


Installing & Using IPTraf on Ubuntu/Debian

Prerequisites
This guide is in the context of using a Debian or Ubuntu derived Linux distribution, and is intended for the type of network traffic seen on a VPS or dedicated server. You can purchase VPS server hosting from a company like Hoverdata, who specialise in providing affordable server hosting plans with reliable up-times.
Introduction
IPTraf is a tried and tested CLI tool for system administrators to monitor low level network connections on their systems. The program is relatively easy to use whilst being simple to navigate, and can be tweaked to the user’s preferences in terms of how the incoming data is formatted. It works by analyzing (or sniffing) the incoming packets on a network hardware device. With the purpose of relaying them back to the administrator to diagnose or problem solve any apparent network issues. The software itself is stored in the Debian/Ubuntu system repositories so is conveniently easy to download and install with the apt-get package manager.
Step 1 — Installing IPtraf
Here’s the command to retrieve it.
|
1 |
sudo apt-get install iptraf |
Any dependencies the program relies on are obtained as usual inclusively with this command.
Step 2 — Running & Main Menu
When running IPtraf make sure it has root/sudo access or privileges as without this it will be unrecognised by the command line.
|
1 |
sudo iptraf |
Here after running it you see some details on the licensing of the software as well as the version number.
As it informs press any key to continue. Upon which you are taken to the main menu where you can access each section of the program.
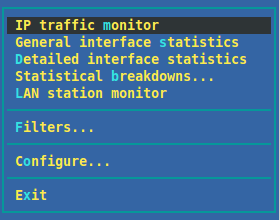
Main Menu
Step 3 — IP Traffic Monitor
In this option TCP IP address connections can be seen on the far left of the screen in the format of source host: port appearing as they occur in real-time. The layouts you’ll encounter are often separated into two main sections within IPTraf in this manner. On the right of the screen in several columns you can see the corresponding packets generated, what sizein bytes they are amounting to, with which TCP flags are attached. Lastly the network interface ID shows which devices the traffic is being received upon.
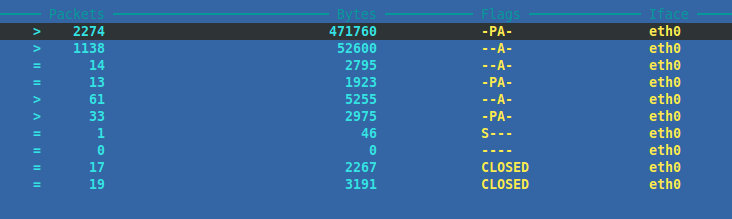
Top Panel
The lower section and panel shows UDP traffic instead. Providing some of the bare bones data generated from these packet types. Then at the very bottom of the screen are values for the number of packets captured on all interfaces so far, with the TCP flow rate when it can be sourced. You can TAB between each of these two main panels to set either of the two as “active”.
Note that pressing ‘q‘ in any of these menu sections returns you back to the main menu.
Step 4 — General Interface Statistics
The second option accessed via the main menu is a bit more generic and contains a lot less specific information. It is useful to confirm that overall the network interface in question is sending and receiving traffic correctly as it should be.

General Statistics
Data here that can be ascertained are the total and amount of packets running across each device, whether any “Bad” or “NonIP” based transactions are taking place, and the overall activity of each device in kilobytes.
Step 5 — Detailed Interfaced Statistics
This choice is arguably more useful than the previous one from the menu as we get a much larger quantity of data presented.

Detailed Statistics
Each column is self explanatory simply remember that the values shown are only from when you opened this section of the menu and not from a set point in a log file or prior to this instance. It is like the other sections you encounter in the program collated in real-time though and useful for determining states of network traffic and devices here and now in the present.
Step 6 — Statistical Breakdowns
This one allows a choice of seeing incoming data by packet size or TCP/UDP port. Including the numbers relevant to each port. In my example screenshot I’ve chosen the latter option.

TCP/UDP
As you’ll see the metrics are the same as previous windows (mostly) but you have the new details on the far left that you chose.
Do note the very bottom of the screen where another strip of information around data rates is provided.
Step 7 — Configure
Here you can set things up to act however you personally desire.
The most notable options perhaps to enable from my point of view are “Reverse DNS lookups” & “Service names”. This first one allows you to see the IP addresses in various parts of the program as domain names instead of octets. When it’s possible to resolve them. Then the second one shows the actual service used on ports (“statistical breakdown”) instead of the port numbers themselves.
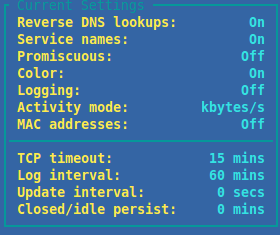
Configure
Conclusion
I have purposefully missed out the two most user specific sections available on the main menu for you to explore yourself. These are also some would say not the most useful of areas in the program, depending upon your intention and what exactly you want to use the program for. If you are needing to filter out several different types of traffic on incoming IP addresses, then you may actually find use here (filters). As said explore and play around with the two unexplained sections to see if they are indeed useful to yourself.
We hope you found this post interesting and agree that IPTraf is a handy basic monitoring utility to bring out when nothing fancy is needed and you want some ease of use.